Effect of Flow Velocity on Liquid Flow Structure and Particle Motion in Pipe Bends
5.1.1 Evolution of the Flow Field in the Bend
The influence of flow velocity on the flow field characteristics within the pipe bend was investigated while the bend diameter ratio and solid particle concentration were kept constant. A bend diameter ratio of R/D = 3.5 and a solid particle concentration of 10% were adopted. Three inlet flow velocities—1 m/s, 2 m/s, and 3 m/s—were considered. Velocity field distributions were extracted at four cross-sections along the bend, corresponding to bend angles of 30°, 45°, 60°, and 90°, respectively. As shown in Figures 5-1(a), (b), and (c), flow separation initiates near the 30° cross-section on the inner arc side of the bend, with pronounced outward diffusion observed near the 90° cross-section. Comparing the flow field distributions at the three velocities shows that as the flow speed increases from 1 m/s to 3 m/s, flow separation on the inner arc side gradually shifts further downstream. Figure 5-1(d) shows the velocity distribution in the X–Y plane, where pronounced velocity gradients appear near the inner arc of the bend, while velocity changes near the outer arc remain comparatively small. Flow separation along the inner arc starts to develop around the 45° cross-section and is nearly fully developed by the 90° cross-section. In the downstream straight section, the fluid velocity is higher near the bottom and sidewalls compared to other regions.
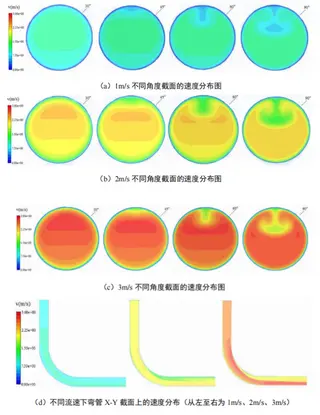
Figure 5-1. Velocity field distributions within the bend at different flow velocities:
(a) Velocity distribution at different angular positions for a flow velocity of 1 m/s
(b) Velocity distribution at different angular positions for a flow velocity of 2 m/s
(c) Velocity distribution at different angular positions for a flow velocity of 3 m/s
(d) Velocity distribution in the X–Y plane at different flow velocities (from left to right: 1 m/s, 2 m/s, and 3 m/s)
Figure 5-2 shows the approximate fluid trajectories at four downstream cross-sections, with the initial helical flow concentrated near the inner arc sidewall. As the flow progresses, it gradually shifts toward the pipe center and the outer arc. To maintain stability and continuity, fluid near the outer wall moves toward the inner arc under pressure differences, forming a secondary symmetrical flow within the bend. The interaction of this secondary flow with the axial mainstream generates a helical flow pattern downstream, increasing wall shear stress and exacerbating erosion.
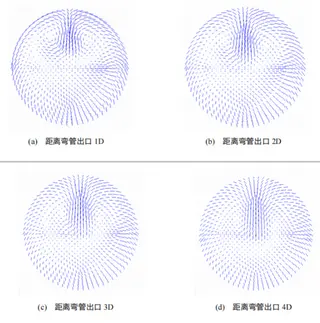
Figure 5-2. Fluid trajectory diagrams at different cross-sections of the downstream straight pipe
(a) 1D downstream of the bend outlet (b) 2D downstream of the bend outlet
(c) 3D downstream of the bend outlet (d) 4D downstream of the bend outlet
5.1.2 Pressure Variation within the Bend
With the bend diameter ratio and solid particle concentration held constant, the influence of flow velocity on the pressure field within the bend is examined. A bend diameter ratio of R/D = 3.5, a solid particle concentration of 10%, and three inlet flow velocities—1 m/s, 2 m/s, and 3 m/s—are considered. Pressure field distributions were obtained at four cross-sections along the bend, corresponding to bend angles of 30°, 45°, 60°, and 90°. As shown in Figures 5-3(a), (b), and (c), the pressure gradient near the outer arc of the bend is relatively small, with a comparatively thick pressure distribution layer, while near the inner arc, the pressure gradient is larger and the pressure distribution layer is thinner. Figure 5-3(d) shows the pressure contour of the entire pipeline. The pressure is relatively uniform before the fluid enters the bend. Upon entering the bend, the pressure near the outer wall initially rises and then falls, reaching its maximum at the outer arc.
In contrast, the pressure near the inner wall initially decreases and then increases, reaching its minimum at the inner arc. After the fluid exits the bend, the pressure near both the inner and outer walls gradually stabilizes and becomes more uniformly distributed. This behavior is attributed to the sudden change in flow direction as the fluid enters the bend, which generates a significant inertial force. Under this inertial effect, the fluid impinges on the outer arc wall, leading to fluid accumulation and compression, and consequently an increase in pressure. Meanwhile, fluid near the inner arc wall is driven by inertia toward the pipe center and the outer arc, leading to pressure reduction due to fluid diffusion. A comparison of the pressure distributions at flow velocities of 1 m/s, 2 m/s, and 3 m/s shows that the overall pressure distribution pattern within the bend remains essentially unchanged as the flow velocity increases.
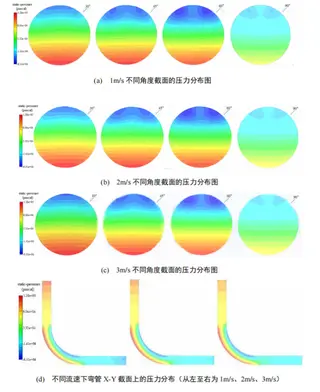
Figure 5-3. Pressure field distributions within the bend at different flow velocities:
(a) Pressure distribution at different angular positions for a flow velocity of 1 m/s
(b) Pressure distribution at different angular positions for a flow velocity of 2 m/s
(c) Pressure distribution at different angular positions for a flow velocity of 3 m/s
(d) Pressure distribution in the X–Y plane at different flow velocities (from left to right: 1 m/s, 2 m/s, and 3 m/s)
5.1.3 Variation in Particle Motion within the Bend
When the bend diameter ratio and solid particle concentration are kept constant, the influence of flow velocity on particle motion within the bend is investigated. A bend diameter ratio of R/D = 3.5, a solid particle concentration of 10%, and three flow velocities of 1 m/s, 2 m/s, and 3 m/s are considered. Figure 5-4 shows the particle trajectories within the bend at different flow velocities. As shown in Figure 5-4, when solid particles enter the upstream straight pipe section at different velocities, the particle stream maintains a relatively stable velocity and flow direction. However, the presence of the bend induces an abrupt change in flow direction. Due to inertia, most solid particles are unable to adjust their trajectories instantaneously and therefore collide with the outer wall of the bend. A small fraction of particles, influenced by local flow disturbances and their proximity to the wall, avoid direct collision with the outer wall. In the downstream straight pipe section, the combined effects of gravity and secondary flow cause most particles to concentrate near the bottom and the outer wall. The particle trajectories within the bend indicate that particle–wall collisions occur predominantly on the outer wall, with secondary collisions observed near the bend outlet and in the downstream straight pipe section. At the 30° and 45° sections, centrifugal forces primarily drive particles toward the outer wall, causing frequent collisions there while collisions on the inner wall are nearly absent. At the 60° and 90° sections, most particles still collide with the outer wall, but some rebound from earlier impacts and are deflected toward the inner wall, resulting in a small number of secondary collisions there. Additionally, rebounds from the bend’s outer wall cause many particles to experience secondary collisions with the outer wall of the downstream straight pipe section. A comparison of particle trajectories at the three flow velocities (1 m/s, 2 m/s, and 3 m/s) shows that at 1 m/s, particles mainly follow the fluid flow, and their relatively low kinetic energy causes them to be strongly affected by centrifugal forces in the bend, leading to frequent collisions with the outer wall. Only a few particles collide with the inner or upper walls. After entering the downstream straight pipe section, the low flow velocity, combined with gravity, causes most particles to settle toward the middle and lower regions of the pipe, with minimal collisions on the upper wall. As the flow velocity increases, collisions between particles and the outer wall become markedly more frequent, while secondary collisions on the upper wall of the downstream straight pipe section also increase significantly. At flow velocities of 2 m/s and 3 m/s, most particles continue to travel close to the outer and lower walls. However, compared with the 1 m/s case, collisions with the inner and upper walls increase within the bend, and more particles are distributed near the upper and side walls. Overall, particle collision velocity within the bend follows the order: 3 m/s > 2 m/s > 1 m/s.
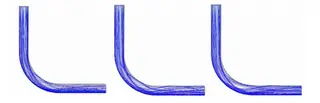
Figure 5-4. Particle trajectories within the bend at different flow velocities (from left to right: 1 m/s, 2 m/s, and 3 m/s)
5.1.4 Variation of Shear Force on the Inner Wall of the Bend
When the bend diameter ratio and solid particle concentration are kept constant, the effect of flow velocity on the shear force distribution along the inner wall of the bend is examined. A bend diameter ratio of R/D = 3.5 and a solid particle concentration of 10% were adopted, with three flow velocities of 1 m/s, 2 m/s, and 3 m/s. Figure 5-5 shows the shear force distribution along the inner wall of the bend, as well as the local shear force variations at different flow velocities. Variations in wall shear force are primarily caused by changes in pressure and velocity along the inner wall of the bend, while the combined effects of the axial main flow and secondary flow also significantly influence the shear force distribution. As shown in Figure 5-5, the wall shear force remains relatively stable from the inlet throughout the upstream straight pipe section. Upon entering the bend, the shear force on the inner arc sidewall increases with higher flow velocities, while the shear force on the outer arc sidewall decreases as the flow velocity drops. In the transition region between the bend and the downstream straight pipe, flow separation near the inner arc sidewall causes the wall shear force to initially decrease and then rise. In contrast, along the outer arc sidewall, the longer buffering effect causes the shear force to change more gradually, rising slowly with increasing flow velocity and eventually stabilizing at a relatively constant level. Comparing the wall shear force distributions at the three flow velocities (1 m/s, 2 m/s, and 3 m/s) shows that the overall pattern of shear force along the inner wall of the bend remains essentially unchanged as the flow velocity increases.
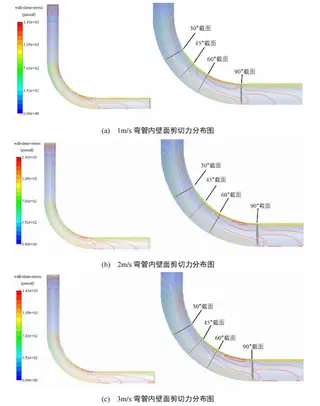
(a) Shear force distribution on the inner wall of the bend at 1 m/s
(b) Shear force distribution on the inner wall of the bend at 2 m/s
(c) Shear force distribution on the inner wall of the bend at 3 m/s
Figure 5-5. Shear force distribution on the inner wall of the bend at different flow velocities
Send your message to this supplier
Related Articles from the Supplier
Related Articles from China Manufacturers

Effect of Raw Material Quality on Forgings
- Jul 03, 2015
Effect of Heat Treatment on Die-cast Aluminum Alloys
- Jun 24, 2024


Related Products Mentioned in the Article
Supplier Website
Source: https://www.landeepipefitting.com/effect-of-flow-velocity-on-liquid-flow-structure-and-particle-motion-in-pipe-bends.html