Guide to Control Valve Flashing and Cavitation
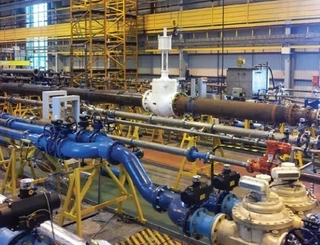
In industrial fluid control systems, the control valve (or regulating valve) acts as the critical "throat" responsible for managing flow and pressure. They are indispensable assets across industries like petrochemicals, power generation, water treatment, and pharmaceuticals.
However, when a liquid medium passes through a valve under a high-pressure drop, complex physical changes occur within the flow channels. Among these, flashing and cavitation are the two most common and destructive severe service conditions. While they are triggered by similar circumstances, their underlying physics, damage characteristics, and engineering remedies are fundamentally different. Failing to accurately identify these phenomena and apply targeted solutions leads to severe erosion of valve trim, compromised sealing, aggressive system vibration, and ultimately, costly unplanned shutdowns.
Starting from the foundational physics of fluid throttling, this article systematically breaks down the mechanics, core differences, damage signatures, detection methods, and engineering mitigation strategies for both flashing and cavitation—offering practical references for control valve selection, design, and lifecycle maintenance.
Principles of Fluid Throttling and Pressure Behavior
To master the mechanics of flashing and cavitation, one must first understand how fluid behaves during throttling. This relies on two core concepts: the velocity-pressure relationship and the vena contracta with its subsequent pressure recovery.
1. The Interplay of Velocity and Pressure
As fluid travels through a control valve, its flow state changes dramatically. When forcing its way into the narrowest restriction of the valve trim (the throttling orifice), the flow area constricts, causing the fluid velocity to instantly spike. Conversely, as the fluid exits the trim and enters the wider downstream cavity of the valve body, it slows back down.
This drastic change in velocity directly alters the kinetic energy of the fluid molecules. According to the law of conservation of energy in a steady-state flow system, an increase in kinetic energy must be balanced by a decrease in potential energy. In fluid dynamics, this potential energy manifests as pressure. Consequently, where velocity spikes, pressure drops; where velocity slows down downstream, pressure partially recovers.
2. The Vena Contracta and Pressure Recovery
The point of minimum cross-sectional flow area within the valve—where fluid velocity peaks and pressure drops to its absolute lowest—is known as the "vena contracta." As the fluid continues to expand into the downstream piping, velocity decreases, and pressure begins to rise again. This phase is termed "pressure recovery."
The extent of this pressure recovery depends heavily on the internal geometry of the valve and the resistance characteristics of the downstream piping. For liquid media, whether the pressure at the vena contracta drops below the liquid’s liquid saturated vapor pressure acts as the definitive on/off switch for flashing or cavitation.
How Flashing and Cavitation Form?
While both phenomena begin when a localized pressure drop causes a liquid to boil and form vapor bubbles, their final outcomes follow completely different trajectories.
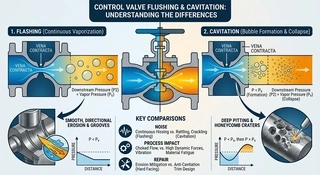
1. Flashing: Continuous, Irreversible Vaporization
When the pressure at the vena contracta drops below the saturated vapor pressure of the liquid at its operating temperature, the liquid flashes into vapor bubbles.
In a flashing scenario, the downstream pressure remains continuously below the liquid's vapor pressure. Because the pressure never recovers, the vapor bubbles never collapse or re-condense back into liquid; they remain as a stable gas phase. Flashing is a textbook example of a stable, two-phase flow. It often leads to a choked flow condition where the flow rate reaches a critical limit and no longer increases, even if downstream pressure drops further.
2. Cavitation: The Violent Collapse of Vapor Bubbles
Cavitation begins identically to flashing—vapor bubbles generate because localized pressure dips below the vapor pressure. However, the defining characteristic of cavitation lies in its downstream pressure recovery behavior.
In a cavitating service, while the pressure briefly dips below the vapor pressure at the vena contracta, it recovers to a level above the saturated vapor pressure further downstream. This sudden pressure spike forces the newly formed vapor bubbles to violently implode. This condensation is highly asymmetrical; one side of the bubble collapses faster than the other, focusing the bubble's energy into a localized, high-velocity liquid micro-jet.
Core Differences: Flashing vs. Cavitation
Though they share a similar origin story, flashing and cavitation diverge completely across pressure behavior, flow states, acoustics, and physical damage. Below is a systematic comparison across three critical dimensions.
1. Pressure Profiles and Flow Regimes
Flashing: Operates under a "no pressure recovery" profile. Downstream pressure stays low, bubbles remain stable, no implosions occur, and virtually no localized implosive energy is discharged.
Cavitation: Follows a "pressure recovery triggers bubble collapse" profile. It involves microsecond-scale bubble implosions that unleash extreme localized energy.
2. Flow States and Acoustic Signatures
Thermodynamically, flashing represents a stable, choked two-phase flow. Once it hits its critical flow state, downstream pressure fluctuations have minimal impact on flow rates. Cavitation, however, usually occurs under non-fully choked conditions where the fluid still experiences pressure recovery, rendering its destructive energy much more concentrated and violent.
Acoustically, the two sound entirely different to field technicians:
- Flashing Noise: Manifests as a continuous, broad-band hissing sound. It is caused by the constant shearing action of the high-velocity liquid-gas mixture, typically averaging frequencies between 2 to 8 kHz.
- Cavitation Noise: Characterized by an intermittent rattling, popping, or crackling sound (often described as "marbles or gravel passing through the valve"). This is the sonic boom of individual vapor bubbles imploding, with frequencies spanning 500 Hz to 4 kHz. Severe cavitation can escalate into a low-frequency, violent rumble that rattles entire piping structures.
3. Equipment Damage Morphology
Inspecting the physical wear on valve internals (plugs, seats, and cages) reveals unmistakable visual footprints:
- Flashing Damage: Appears as directional grooves or smooth, swept erosion lines etched across the metal by the continuous sandblasting effect of high-velocity liquid droplets entrained in vapor. The wear builds up relatively slowly.
- Cavitation Damage: Leaves behind severe pitting and irregular, sponge-like or honeycomb craters. This happens because the high-velocity micro-jets persistently hammer the metal surface at a microscopic level, causing rapid fatigue failure. While flashing is destructive, cavitation is far more aggressive and fast-acting.
The Destructive Power and Hazards of Cavitation
Between the two conditions, cavitation is arguably the far more lethal enemy of control valves.
Laboratory studies indicate that the liquid micro-jets fired by collapsing bubbles can reach speeds of 100 m/s. Because these micro-jets impact an incredibly minuscule surface area, they generate staggering localized pressures.
1. How intense is a cavitation impact?
In water-based systems, research shows localized impact pressures can rocket up to 1500 N/mm² (roughly 1.5 GPa or 220,000 psi)! This vastly exceeds the yield strength of standard stainless steels and specialized alloys, allowing cavitation to literally tear through metal like paper.
2. System-Wide Impacts
- Loss of Control Precision: Erosion eats away at the plug and seat sealing surfaces, creating severe internal seat leakage (passing) and destroying the valve's capability to regulate flow precisely.
- Severe Noise and Vibration: High-decibel noise poses workplace safety hazards, while brutal mechanical vibrations can fatigue pipe supports, crack weld joints, and damage upstream/downstream instrumentation.
- Severe Economic Penalties: Frequent trim replacement, heavy maintenance labor overhead, and the risk of catastrophic downtime due to long lead times for specialized replacement parts kill process efficiency and profitability.
Field Testing and Evaluation Methods
Accurate diagnosis is the prerequisite for implementing effective engineering fixes. Industrial field applications primarily rely on two evaluation methods: cavitation index engineering and acoustic/vibration spectrum analysis.
1. Engineering Use of the Cavitation Index
Engineers quantify cavitation risk during the valve selection phase using a calculated cavitation index. A high index indicates a safe operating zone. As the index drops, the system moves through stages of incipient cavitation, developed cavitation, and finally, severe cavitation.
Designers mitigate this by raising upstream pressure, increasing the Net Positive Suction Head (NPSH) margin, or optimizing valve trim geometry. Ensuring a healthy NPSH margin is a fundamental defense metric against vapor formation in both pumps and valve networks.
2. Acoustic Monitoring and Vibration Analysis
In active operations, flashing and cavitation are differentiated by tracking acoustic frequencies and structural vibrations. Flashing produces a relatively flat, continuous signal, whereas cavitation yields highly distinct, sharp impulse peaks paired with high-frequency structural acceleration.
Modern facilities utilize accelerometer sensors and acoustic transmitters clamped to the valve body for real-time monitoring. By analyzing frequency spectrum shifts, predictive maintenance systems flag cavitation at its earliest onset, giving engineers the data needed to make timely operational adjustments.
Engineering Mitigation and Optimization Strategies
Once the severe service risk is evaluated, engineers build a multi-layered defense utilizing advanced valve design, hard facing metallurgy, and system-level pressure management.
1. Advanced Valve Internals (Multi-Stage Pressure Drop)
- Managing Flashing: Since flashing is dictated purely by the fluid's thermodynamic state, it cannot be engineered away if the process parameters demand that specific pressure drop. Instead, mitigation relies on increasing downstream backpressure or using straight-through, hard-faced angle bodies that direct the abrasive two-phase jet away from critical valve surfaces.
- Defeating Cavitation (Multi-Stage Trim): Rather than taking a massive pressure drop across a single throttling step, multi-stage trim breaks the total pressure drop into several smaller increments. By keeping the vena contracta pressure of each individual stage safely above the fluid's saturated vapor pressure, cavitation is stopped before it can even start.
2. Metallurgy and Trim Hard Facing
When running close to cavitation boundaries or dealing with unavoidable flashing, valve trim must be armored with high-hardness, high-toughness materials:
- Stellite Alloys: Cobalt-base alloys applied via overlay or used as solid components; ideal for fighting extreme erosion.
- Tungsten Carbide: Exceptionally hard matrix; the gold standard for high-velocity flows laden with abrasive particulates.
- Inconel Alloys: Retains mechanical integrity under high-temperature, highly corrosive, severe-service environments.
- 400-Series Stainless Steel (Hardened): Offers an excellent, cost-effective economic solution for moderate wear conditions.
Upgrading standard trim to these severe-service alloys drastically increases the Mean Time Between Failures (MTBF), slashing spare parts spend and protecting against catastrophic production losses.
3. System-Level Pressure Management
Smart piping architecture considers inlet pressures, downstream backpressures, and operating range limitations to stabilize the overall process loop. Well-planned piping layouts—such as ensuring a long, straight run of piping downstream of the valve or avoiding immediate elbows—prevent localized pressure drops. Furthermore, installing a downstream restriction orifice plate artificially raises the valve's backpressure, pulling its operation out of the severe cavitation zone.
Additionally, modern control valve engineering heavily leverages Computational Fluid Dynamics (CFD) simulations. Running flow coefficient ($C_v$) calculations, pressure drop profiling, and cavitation index mapping during the front-end engineering design (FEED) phase ensures risks are designed out long before equipment procurement.
Summary
While flashing and cavitation both originate from a fluid pressure drop that falls below the saturated vapor pressure, their physical lifecycles are entirely different.
Flashing is a stable, "no recovery" two-phase flow where bubbles survive, making smooth erosion and directional channeling its primary weapon of destruction.
Cavitation relies on downstream "pressure recovery" to smash those bubbles into violent implosions, unleashing high-velocity micro-jets that cause pitting and deep honeycomb craters.
In engineering design, defining the exact nature of the fluid behavior is the only way to pick the right weapon against it. Deploying multi-stage pressure-drop trim, heavy-duty severe service alloys, elevated NPSH margins, optimized system backpressures, and CFD-backed designs effectively neutralizes these threats. When paired with high-performance actuators that deliver stable control responses, industrial facilities can maximize valve service life, eliminate unexpected downtime, and keep complex processes running safely, predictably, and profitably.
Send your message to this supplier
Related Articles from the Supplier
Guide to Control Valve Flashing and Cavitation
- May 23, 2026
Comprehensive Guide to Control Valve Selection
- Oct 22, 2025
Guide to Pneumatic Diaphragm Control Valve
- Nov 25, 2025
A Guide to Fail-Safe Positioning in Control Valves
- Jul 13, 2024
Related Articles from China Manufacturers
Related Products Mentioned in the Article
Supplier Website
Source: https://www.valvecontrol.cn/news/guide-to-control-valve-flashing-and-cavitation.html