Flow Field Analysis of a New Control Valve Design
Abstract: Control valves play a crucial role in regulating the steam flow entering turbine passages. As turbine efficiency continues to improve, the performance requirements for control valves have become increasingly stringent. However, existing control valves face several flow-related challenges, including boundary layer separation on the valve head, the formation of kidney-shaped vortices, and regions of high turbulent kinetic energy downstream of the valve head. These phenomena hinder further improvements in control valve efficiency. This study begins with a structural analysis of the valve head and valve seat, examining the internal flow characteristics of the control valve and identifying the key factors influencing its flow performance. Numerical results indicate that the improved control valve structure effectively optimizes the internal flow conditions and significantly reduces the total pressure loss coefficient.
Introduction
Control valves are a critical component of steam turbine flow systems. During turbine operation, the upward and downward movement of the valve head regulates the steam flow rate, thereby controlling the turbine’s rotational speed and power output. Due to the complex internal flow structure of the valve, some pressure loss is inevitable. Since the working steam must pass through the control valve before entering the turbine’s main flow path, the valve’s efficiency directly affects the overall economic performance of the turbine. Han Zhonghe et al. reported that a 1% increase in valve pressure loss can result in a 0.4% decrease in turbine efficiency. The fluid passing through the valve exhibits complex and highly swirling motion. Pressure loss results from a combination of factors, including throttling at the valve throat, boundary layer separation on the valve head surface, cavitation beneath the valve seat, and the formation of kidney-shaped vortices. These effects generate strong vortices in the downstream region, leading to significant pressure losses. Zheng Guo et al. performed a computational analysis of the hollow valve head structure in a 300 MW steam turbine. Their results revealed that cracks, pits, and irregular flow path designs within the valve casing induced severe flow instabilities downstream of the valve. Optimizing the internal cavity geometry produced smoother flow, thereby enhancing the unit’s safety and economic performance. Shu Xiangting et al. found that at small valve openings, internal turbulence within the control valve intensifies, and flow-induced vibrations can lead to resonance, posing significant risks to both valve safety and efficiency. Yang Zongxin et al. addressed the high flow losses associated with spherical valve heads by proposing a novel filter design. This design stabilized the downstream flow field at small valve openings, reduced the total pressure loss coefficient, and improved overall flow performance. Li Mingqiang optimized the steam distribution system so that, under all operating conditions, each valve operated at a relatively large opening, significantly reducing throttling losses and improving partial-load efficiency. Xiang Xiaowei proposed adding guide ribs within the valve cavity of solid valve heads to eliminate the low-pressure region beneath the valve head and reduce backflow. However, this modification did not result in a substantial improvement in internal flow. Xiao Xin et al. optimized the diffuser angle, hollow valve head profile, and eccentricity of hollow-valve control valves, determining the optimal parameters that minimized internal pressure losses. Zhou Liu et al. applied anisotropic machining to the valve cage window, maintaining high control sensitivity at low flow rates, enhancing system stability, and improving internal flow conditions. Li Yixing et al. analyzed both conical solid and hollow valve heads and proposed a hollow valve head equipped with a guide cone, which improved flow behavior at small valve openings. Building on these studies, this paper analyzes the flow structure of a hollow valve head in a specific type of steam turbine and introduces a cosine valve head design. Computational analysis demonstrates that the cosine valve head effectively modifies the internal vortex distribution, substantially reduces vortex intensity, and lowers the overall pressure loss coefficient, thereby enhancing flow efficiency through the valve.
1. Model and Mesh Introduction
The steam turbine control valve features an axial steam inlet along the x-axis and a radial air outlet along the y-axis, as illustrated in Figure 1. The working fluid enters the annular valve cavity through the inlet, passes through the throat section between the valve head and the valve seat, flows into the outlet channel within the valve seat, and finally exits the valve. Raising the valve head increases the throat area between the valve head and the seat, thereby regulating the flow rate through the control valve. Figure 1 illustrates the streamlines inside the control valve, as well as the positions of the inlet and outlet surfaces. The inlet is specified as a mass flow inlet, while the outlet is defined as a pressure outlet. The valve stem, valve head, valve seat, and the inner surfaces of the valve cavity are treated as no-slip, adiabatic walls. The boundary conditions for the inlet and outlet are summarized in Table 1.
Table 1 Boundary Conditions
|
Boundary Name |
Unit |
Value |
|
Mass Flow Inlet |
kg/s |
1.115 |
|
Inlet Temperature |
°C |
50 |
|
Outlet Pressure |
MPa |
2.1 |
|
Wall |
— |
No-slip Adiabatic Wall |
|
Computational Medium |
— |
Air |
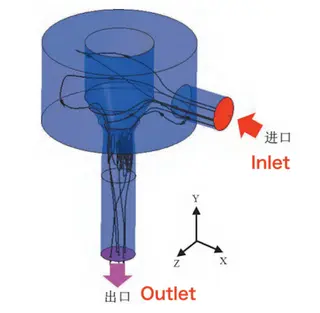
Figure 1 Computational Model and Boundary Conditions
Numerical simulations were conducted using CFD software, based on the steady-state Reynolds-Averaged Navier–Stokes (RANS) equations. The Shear Stress Transport (SST) turbulence model was employed. Both the advection terms in the conservation equations and those in the turbulence transport equations were solved using the software’s second-order upwind scheme. The computational residuals converged to approximately 10⁻⁵. The computational grid was of a hybrid type. A structured mesh was applied to the boundary layer region near the wall, with y+<1y^+ < 1y+<1 and a growth rate of 1.1, consisting of 30 layers. An unstructured mesh was employed in regions farther from the wall to better capture the complex flow path. Figure 2 illustrates the hybrid grid distribution used in the control valve model. Based on previous studies, this computational approach has been shown to produce accurate and reliable results.
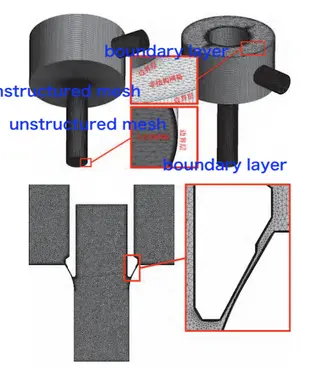
Figure 2 Hybrid Grid
Grid independence was verified using the inlet total pressure as the evaluation parameter. The total number of grid cells was adjusted by varying the number of elements along each edge. Five grid configurations were tested, and the corresponding grid independence curve is presented in Figure 3. The total number of grid cells for each configuration is listed in Table 2. As shown in Figure 3, when the total number of grid cells exceeds 8.1 million, the calculation results stabilize and become nearly independent of grid density. Therefore, the G3 grid configuration was selected for subsequent simulations and analyses.
Table 2 Number of Grids
|
Grid Name |
Grid Number (×10⁴) |
|
G1 |
458 |
|
G2 |
680 |
|
G3 |
810 |
|
G4 |
962 |
|
G5 |
1081 |
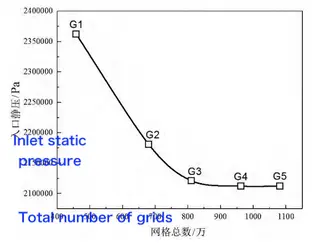
Figure 3 Grid Independence Curve
2. Flow Characteristics of the Hollow Valve Head
Figure 4 presents the velocity contours and streamline distributions for the control valve with a hollow valve head. The Y and Z axes correspond to the coordinate system shown in Figure 1. As illustrated in Figure 4, after passing through the throat, the fluid primarily flows downstream within the region between z/Z=0.4–0.6, closely following the valve seat wall. A distinct flow separation structure forms on the valve head surface at z/Z=0.55 and y/Y=0.7, corresponding to the trailing edge of the valve head profile, where the flow channel undergoes a sudden expansion. This abrupt expansion generates a back-step effect, which is the primary cause of boundary layer separation in this region. The boundary layer separation gives rise to a large kidney-shaped vortex within the region z/Z=0.3–0.5 and y/Y=0–0.5, which manifests as a low-velocity zone on the velocity contour map.
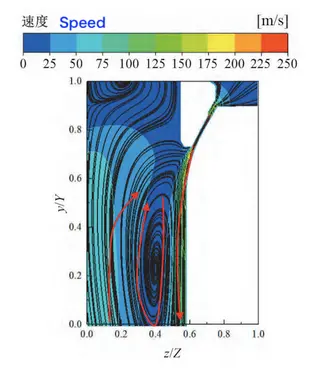
Figure 4 Velocity contours and streamline distribution of the hollow valve head
Figure 5 presents the turbulent kinetic energy (TKE) contours and streamline distribution for the same configuration. The Y and Z axes correspond to those shown in Figure 1. As shown in Figure 5, two high turbulent kinetic energy regions and a saddle point are identified. The first high-TKE region (HR1-TKE) occurs near the throat (z/Z=0.2,0.8;y/Y=0.7), while the second high-TKE region (HR2-TKE) is located within the kidney-shaped vortex zone (z/Z=0.3–0.4,0.6–0.7;y/Y=0.3–0.7. The peak TKE values and their corresponding locations are indicated in Figure 5. A saddle point is located at z/Z=0.05 and y/Y=0.7. Combined with the flow analysis in Figure 4, this saddle point represents the downstream end of the kidney-shaped vortex, where the flow splits into two components: an upward-rolling flow and a downward-moving flow. Downstream of the saddle point, the flow gradually stabilizes. The length of the turbulent flow region is approximately twice the diameter of the valve seat throat. The intense turbulence and high-TKE regions in this area result in substantial energy losses, thereby reducing the overall flow efficiency of the control valve.
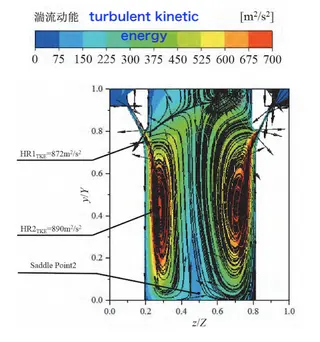
Figure 5 Turbulent kinetic energy contour and streamline distribution of the hollow valve head
2. Cosine Valve Head Structure and Flow Analysis
Flow field analysis of the hollow valve head indicates that the turbulent region downstream of the control valve originates from boundary layer separation on the valve head. This separation induces the formation of kidney-shaped vortices and regions of high turbulent kinetic energy (TKE). The boundary layer separation corresponds to the profile depression on the valve head and the abrupt expansion of the flow passage. Based on this observation, it is hypothesized that eliminating the profile depression and smoothing the valve flow channel would reduce flow separation and turbulence, thereby enhancing overall flow behavior. To verify this hypothesis, a new valve head profile was developed using a cosine function, forming the so-called cosine valve head structure. The governing equation for the cosine profile is expressed as:
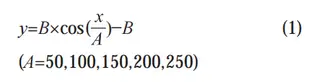
In this equation, A denotes the length of the valve head (Figure 6), with larger values of A corresponding to longer valve heads. B represents the valve head radius, which can be adjusted to match the desired control valve geometry by modifying the valve seat region. In this study, BBB is set to 100 for each valve, based on the selected valve seat diameter. Figure 6 shows the valve head profile constructed using the cosine equation. The Figure 6 shows the valve head profile constructed using the cosine equation. The Y and Z axes correspond to those defined in Figure 1. The dotted line at Z=0 denotes the central symmetry axis, indicating that the valve head profiles on both sides are identical. As shown in Figure 6, the cosine valve head provides a smoother flow transition and avoids abrupt changes in flow area. Increasing AAA results in a proportionally longer valve head.
Figure 6 Cosine valve head profile
Figure 7 presents the velocity contours and streamline distributions for the cosine valve head with A=150. The Y and Z axes correspond to those shown in Figure 1. The cosine valve head maintains the same throat area, meshing strategy, and boundary conditions as those used for the previously discussed hollow valve head. As shown in Figure 7, after passing through the throat between the valve head and the seat, the flow develops uniformly along the gradually diverging path formed between the two surfaces. A low-velocity region is observed near the valve seat within z/Z=0.5 and y/Y=0–0.5; however, no flow separation bubbles or boundary layer detachment are present on either the valve seat or the valve head surface.
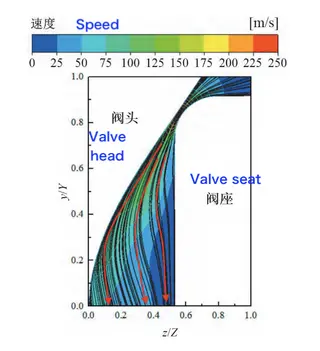
Figure 7 Velocity contours and streamlines for the cosine valve head (A=150)
Figure 8 presents the turbulent kinetic energy (TKE) contours and streamlines for the cosine valve head with A=150. Two distinct high-TKE regions are observed within the flow field. The first high-TKE region (HR1-TKE) occurs at the throat (z/Z=0.2,0.8;y/Y=0.9), while the second region (HR2-TKE) is located downstream of the cosine ridge (z/Z=0.5;y/Y=0.2). The high-TKE zone downstream of the valve head results from the convergence of fluid along the cosine surface, but no evident vortex formation is observed in the streamline diagram. The reduction in TKE intensity near the throat is attributed to the optimized valve seat geometry, which alleviates the abrupt contraction previously observed in the hollow valve head. Both high-TKE regions exhibit significantly lower intensity compared to those in the hollow valve head, and the disappearance of the kidney-shaped vortex further diminishes turbulence. The maximum TKE values for each region are summarized in Table 3. These results confirm that the A=150 cosine valve head achieves a smoother flow pattern and lower flow losses compared to the hollow valve head design.
Table 3 Maximum values in high-TKE regions (unit: m²/s²)
|
High-TKE Region |
Hollow Valve Head |
A = 150 Cosine Valve Head |
|
HR1 |
872 |
860 |
|
HR2 |
890 |
575 |
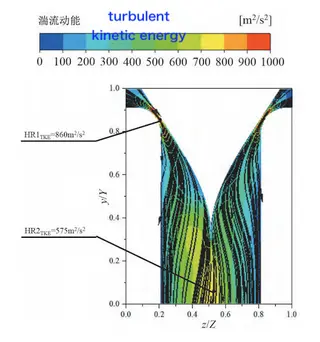
Figure 8 Turbulent kinetic energy contours and streamlines for the cosine valve head (A = 150)
4. Flow Field Analysis and Optimization of Valve Head Structures with Different A Values
Figure 9 presents the turbulent kinetic energy (TKE) contours for cosine valve heads with A=50, A=100, and A=150. The Y and Z axes correspond to the coordinate system defined in Figure 1. For all cosine valve heads, the flow throat area, mesh generation method, mesh density, and boundary conditions are kept consistent to ensure comparability. As shown in Figure 9, increasing the value of A has little effect on the intensity and extent of HR1, the high-TKE region at the throat. However, the intensity of HR2, the downstream high-TKE region near the end of the valve head, changes significantly. As AAA increases, the HR2 region gradually shifts downward, and its peak intensity decreases. This reduction is attributed to the smaller impact angle between the downward-flowing fluid along the valve head and the downstream surface. In other words, as AAA increases, the cosine profile becomes more gradual, mitigating flow collisions and reducing energy dissipation at the valve head outlet.
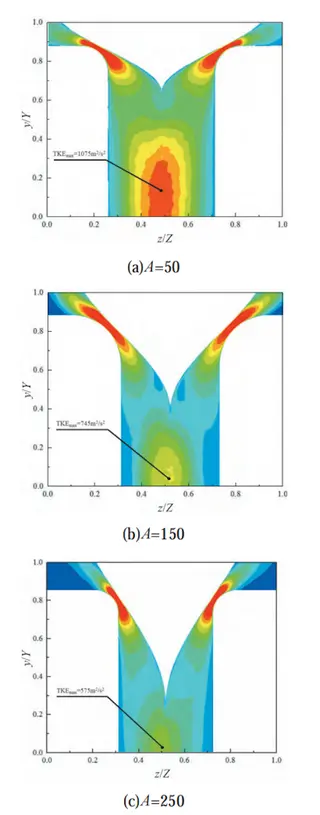
Figure 9 Turbulent kinetic energy contours of cosine valve heads with A = 50, 100, and 150
To quantitatively evaluate the flow performance of different valve head structures, the total pressure loss coefficient ζ is introduced as a measure of the valve’s hydraulic efficiency. It is defined as follows:
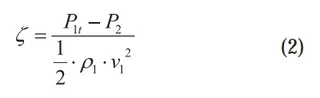
where:
Pu — inlet total pressure,
P2 — outlet static pressure,
ρ1 — inlet steam density,
v1 — inlet steam velocity.
The total pressure loss coefficient characterizes the loss of total pressure energy (kinetic plus static) induced by the control valve. A larger ζ indicates greater total pressure loss and, consequently, lower flow efficiency. Figure 10 shows the total pressure loss coefficients for different valve head structures at various valve openings. The horizontal axis represents the valve stroke, reflecting the effective flow area between the valve head and the seat, while the vertical axis represents the total pressure loss coefficient. It can be observed that the cosine valve heads exhibit significantly lower total pressure loss coefficients compared to the hollow valve head. Moreover, as AAA increases, the total pressure loss coefficient decreases more markedly, indicating improved flow performance. When AAA exceeds 200, further increases have only a minor effect on ζ. For all valve head structures, the total pressure loss coefficient decreases as the valve opening increases. The relative ranking of ζ\zetaζ among the different structures remains unchanged throughout the entire stroke range. Notably, the cosine valve head demonstrates superior performance at both small openings, by reducing local flow resistance, and large openings, by maintaining smooth flow expansion. Considering both flow efficiency and engineering feasibility, the A=100A = 100A=100 cosine valve head offers the optimal balance. It achieves a substantial reduction in pressure loss without excessively increasing the valve head length or compromising mechanical strength.
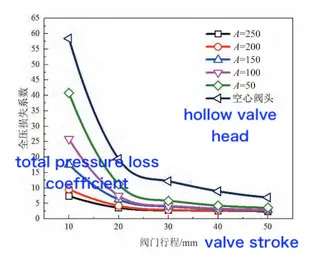
Figure 10 Total pressure loss coefficients of cosine and hollow valve heads
5. Conclusion
This study numerically simulated and analyzed the internal flow characteristics of a steam turbine control valve and proposed a cosine valve head structure to enhance flow performance. The main conclusions are as follows:
- Flow separation and vortex formation in hollow valve heads:
Conventional hollow valve heads exhibit boundary layer separation and the formation of kidney-shaped vortices due to the sudden expansion of the flow passage. These phenomena generate large turbulent kinetic energy regions downstream of the valve, resulting in substantial total pressure loss.
- Improved flow characteristics with the cosine valve head:
The cosine valve head, designed using a trigonometric cosine profile, effectively eliminates boundary layer separation and suppresses the formation of kidney-shaped vortices. This optimization significantly reduces total pressure loss and enhances the overall flow efficiency of the control valve.
- Effect of parameter A on valve performance:
Parametric analysis of cosine valve heads with different A values indicates that increasing A reduces the total pressure loss coefficient but results in a longer valve head. Excessive valve head length may pose structural challenges and complicate strength design. Balancing flow efficiency and structural integrity, the A=100 cosine valve head is identified as the most practical replacement for the hollow valve head.
Send your message to this supplier
Related Articles from the Supplier
Flow Field Analysis of a New Control Valve Design
- Oct 31, 2025

Related Articles from China Manufacturers
Flow Characteristics of Control Valve
- Aug 19, 2015

Flow Expo 2015, 21 March, Long Beach, CA, US
- Oct 10, 2014
Flow direction of a globe valve
- Sep 16, 2019
Flow Direction Design of Three-Way Ball Valves
- Dec 14, 2024
Related Products Mentioned in the Article
Supplier Website
Source: https://www.vervovalve.com/news/flow-field-analysis-of-a-new-control-valve-design.html