Optimization Design of a Wedge Gate Valve Plate Based on RSM
Abstract
This study focuses on the wedge gate valve plate and employs Response Surface Methodology (RSM) to optimize its structural parameters. The mass, maximum stress, and maximum deformation of the valve plate under maximum static pressure were selected as response variables. Sensitivity analysis was performed on the structural parameters of the valve plate. After sampling the design variables using the Latin hypercube algorithm, an orthogonal experimental design was conducted. A genetic algorithm was then employed to fit the response surface prediction model. Minimizing the mass, stress, and deformation was defined as the optimization objective. A multi-objective genetic algorithm was then applied to solve the optimization problem based on the prediction model. The results indicate that after optimization, the mass of the valve plate was reduced by 2.53%, the maximum stress by 4.9%, and the maximum deformation by 17%, significantly improving its self-sealing performance. For the structural parameter optimization of a wedge gate valve plate, combining parameter sensitivity analysis with RSM allows for the rapid and effective identification of the optimal design solution. The optimized gate plate demonstrates enhanced operational stability and improved sealing reliability.
Wedge gate valves are widely employed in valve systems for oil pipelines, pressurized water pipelines, and gas transmission networks. The sealing performance of the valve directly influences the safety and transport efficiency of the entire pipeline system. Extensive research on valve optimization has been conducted both domestically and internationally. Liu Peng et al. proposed a method combining comprehensive fluid characteristic analysis with sensitivity evaluation to optimize subsea gate valves. They conducted orthogonal experiments on key valve parameters to enhance peak flow velocity and reduce maximum gate deformation. Ali Rezghi et al. performed multi-objective optimization on the closing characteristics of a turbine gate valve and the position of the pressure regulating box in an overpressure water pump, achieving a significant reduction in pump overspeed. Ni Hongjun et al. conducted numerical simulation and warpage analysis of the compression molding process for fluoropolymer-lined valve bushings, optimizing dimensional accuracy and reducing the number of production trials required. Zhang Bo et al. optimized the flow channel structure of electronic water valves for new energy vehicles using CFD simulations, effectively reducing both direct-flow and bypass pressure drops. Yang Xiaobo et al. carried out three-dimensional modeling and finite element simulations of supercritical valves, using statistical analysis methods to optimize their structural parameters. In valve structural optimization, it is common to define specific valve performance characteristics as optimization objectives and to adjust multiple dimensional parameters to achieve an optimal design configuration. However, when the number of design variables is large, the optimization process often incurs high computational demands and extended development cycles. In this study, a static analysis of a wedge gate valve under maximum design pressure in the fully closed state was performed. Sensitivity analysis of the key structural parameters of the gate was first conducted using ANSYS software, and the parameters exhibiting high sensitivity were selected as design variables. An orthogonal experimental design was subsequently conducted using the Latin hypercube sampling method. The response surface prediction model was fitted using a genetic algorithm, and a multi-objective genetic algorithm was then applied to simultaneously minimize mass, stress, and deformation. Finally, simulation verification confirmed the validity of the optimized design scheme. The results demonstrate that combining sensitivity analysis with response surface methodology can accurately identify the key design variables of the gate, effectively reducing computational workload and shortening the optimization process. The optimized design significantly improves the self-sealing performance and operational stability of the wedge gate valve.
Figure 1 presents the three-dimensional model of the wedge gate valve, which primarily comprises a handwheel, valve bonnet, valve body, valve stem, and wedge gate plate. The rising valve stem typically adopts a trapezoidal thread. Through the nut at the top of the valve and the guide groove on the valve body, the rotational motion of the handwheel is transformed into linear motion, driving the wedge gate plate to move vertically to open or close the valve. The wedge gate plate is made of HT300 gray cast iron and is designed for a maximum working pressure of 2.2 MPa within an operating temperature range of 10–200 °C. During the sealing performance test, a pressure of 1.1 times the maximum allowable working pressure is applied. The material properties of the gate plate are summarized in Table 1.
Table 1 Material parameters of the wedge gate valve plate
|
Parameter |
Elastic Modulus E (GPa) |
Density (kg/m³) |
Poisson’s Ratio |
|
Value |
130 |
7300 |
0.25 |
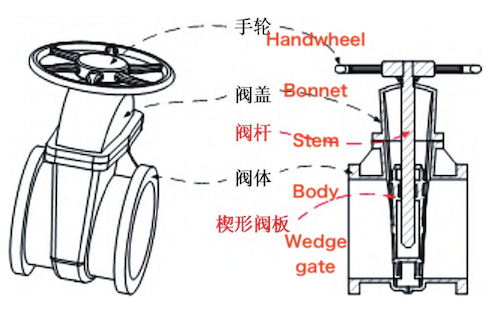
Figure 1 Structural schematic of the wedge gate valve
The static analysis of the wedge gate plate was carried out using ANSYS. The model was discretized into a mesh consisting of 160,809 elements and 252,201 nodes. As illustrated in Figure 2(a), frictional constraints with a coefficient of 1.3 were applied to the contact edges of the gate plate. As shown in Figure 2(b), a pressure of 2.4 MPa was applied to the opposite surface to simulate the self-sealing test water pressure. The simulation results are presented in Figures 2(c) and 2(d). The maximum deformation occurs at the center of the gate plate, measuring 0.347 mm. The maximum equivalent stress occurs at the root of the central flange, reaching 162.33 MPa. The total mass of the wedge gate plate is 13.836 kg.
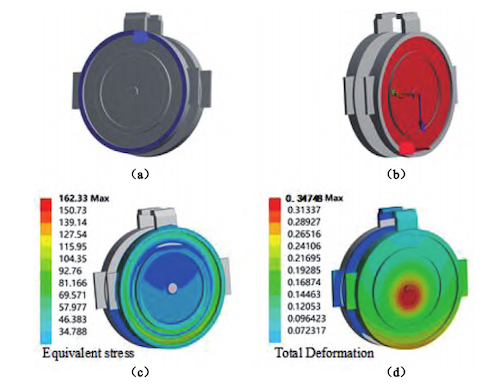
(a) Schematic of constraint application (b) Schematic of pressure loading
(c) Stress distribution cloud diagram (d) Displacement distribution cloud diagram
Figure 2 Static analysis of the base structure of the wedge gate valve
The key structural parameters of the wedge gate plate are illustrated in Figure 3. Sensitivity analysis of these parameters was performed using ANSYS Workbench in combination with SolidWorks. The corresponding sensitivity values for each structural parameter are presented in Figure 4. Direct optimization of the full model would result in a high computational load and prolonged optimization time. Therefore, parameters exhibiting low sensitivity in the mass, stress, and deformation responses were excluded. Only parameters with higher sensitivity values were selected for orthogonal experiments, effectively reducing the computational scale while retaining the most influential factors. Based on the sensitivity diagram, the key structural parameters D1, D2, D4, D5, D6, and D7 were identified and selected as the design variables for the subsequent orthogonal experimental design.
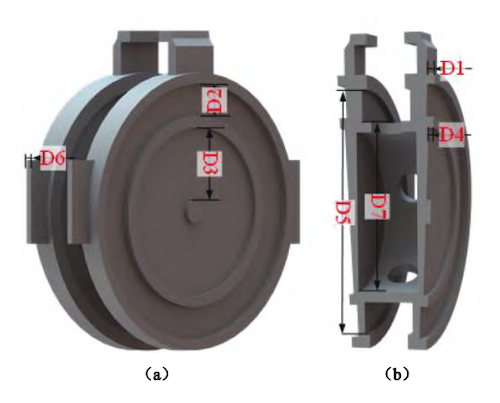
Figure 3. Structural parameter definitions of the wedge gate valve plate
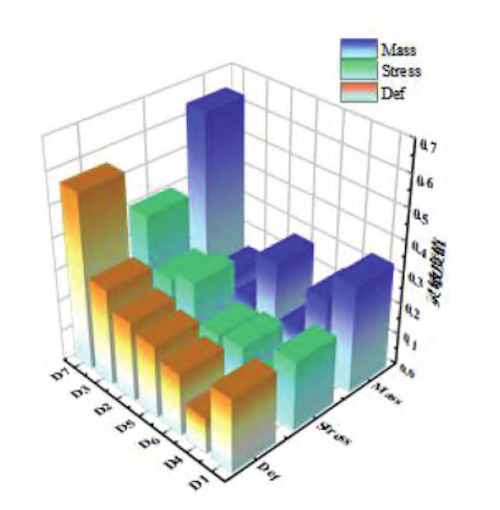
Figure 4. Sensitivity diagram of design parameters
The Design Exploration module in ANSYS was employed for the Design of Experiments (DOE) study, and the Latin hypercube sampling algorithm was used to generate sample points for each design variable. This algorithm efficiently captures the true characteristics of the model using fewer sample points, significantly reducing computational effort while maintaining accuracy. A portion of the DOE experimental data and the corresponding results are presented in Table 2.
Table 2. DOE experimental scheme and results
|
No. |
D1 (mm) |
D7 (mm) |
D6 (mm) |
D5 (mm) |
D4 (mm) |
D2 (mm) |
Mass (kg) |
Deformation (mm) |
Stress (MPa) |
|
1 |
13.627 |
153.013 |
4.956 |
208.533 |
9.720 |
30.533 |
13.806 |
0.111 |
161.180 |
|
2 |
14.187 |
159.724 |
5.444 |
221.822 |
8.280 |
30.933 |
12.925 |
0.132 |
160.730 |
|
3 |
12.631 |
151.671 |
4.822 |
231.022 |
8.960 |
32.400 |
13.300 |
0.127 |
170.582 |
|
4 |
13.876 |
139.591 |
4.778 |
222.844 |
8.200 |
29.067 |
14.405 |
0.105 |
160.632 |
|
5 |
12.756 |
136.236 |
4.867 |
238.178 |
9.760 |
28.667 |
14.219 |
0.112 |
162.868 |
|
… |
… |
… |
… |
… |
… |
… |
… |
… |
… |
|
44 |
13.067 |
137.578 |
5.333 |
237.156 |
8.240 |
27.467 |
14.087 |
0.338 |
160.910 |
|
45 |
14.560 |
163.751 |
5.222 |
215.689 |
9.280 |
32.267 |
12.792 |
0.401 |
191.189 |
The Genetic Aggregation Algorithm was employed to fit the response surfaces of mass, maximum deformation, and maximum stress based on the DOE experimental data. As shown in Figure 5(a), under the optimized mass conditions, when D7 is at a high level, the mass increases as D2 decreases; conversely, when D2 is at a high level, the mass also increases with increasing D7. In Figure 5(b), when D5 is at a high level, an increase in D7 has a relatively minor effect on the mass. However, when D5 is at a low level, an increase in D7 has a more pronounced effect, indicating a strong positive correlation between these two parameters and the mass. Under the optimized maximum deformation conditions, as shown in Figure 6(a), when D2 is at a low level and D7 increases within the range of 140–155 mm, the effect on maximum deformation is minimal. However, when D7 increases within the range of 155–165 mm, its effect on deformation becomes more pronounced. In Figure 6(b), when D6 is at a low level and D5 increases from 210 to 235 mm, the maximum deformation rises sharply. As D5 continues to increase beyond 235 mm, the rate of deformation growth slows, indicating a nonlinear relationship between these two parameters. As shown in Figure 7(a), under the optimized maximum stress conditions, D5 is positively correlated with the maximum stress value. As D5 increases, the maximum stress also rises. When D2 varies gradually, the maximum stress initially decreases and then increases, exhibiting a U-shaped trend. In Figure 7(b), as D5 increases, the maximum stress again exhibits a trend of initially decreasing and then increasing. In contrast, as D6 decreases, the maximum stress first rises and then falls, indicating complex interactive effects between these parameters.
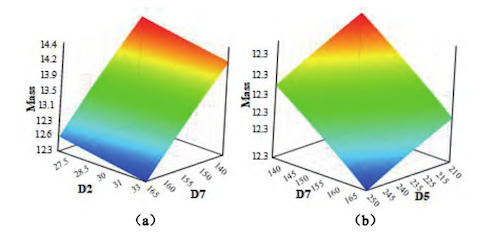
Figure 5. 3D response surface plots of mass under different parameter combinations
(a) Interaction between D7 and D2 (b) Interaction between D7 and D5
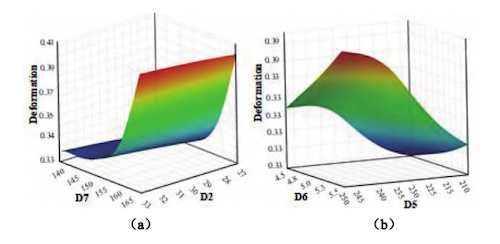
Figure 6. 3D response surface plots of maximum deformation under different parameter combinations
(a) Interaction between D7 and D2 (b) Interaction between D5 and D6
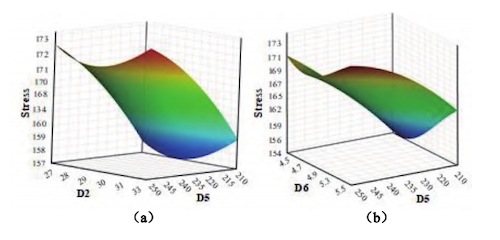
Figure 7. 3D response surface plots of maximum stress under different parameter combinations
(a) Interaction between D5 and D2 (b) Interaction between D5 and D6
In the structural optimization of the wedge gate plate, the objectives of minimizing mass, maximum deformation, and maximum stress are inherently conflicting, making it challenging to achieve simultaneous optimal performance across all three criteria. To address this challenge, a multi-objective genetic algorithm (MOGA) within the Design Exploration module of the ANSYS platform was employed to optimize the structural parameters of the wedge gate plate. The optimization objectives were defined as follows:
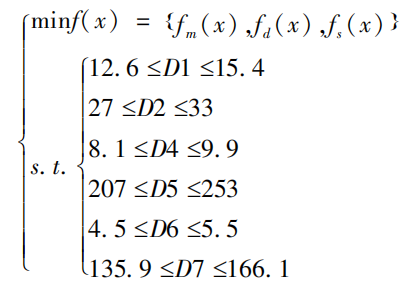
Using the response surface prediction model, the minimum mass, minimum deformation, and minimum stress were set as the optimization objectives, and iterative solutions were carried out. A sample solution set is presented in Figure 8. When all objective responses simultaneously reached their optimal values, the corresponding input parameters were:
D1 = 15.134 mm, D7 = 146.67 mm, D6 = 4.5462 mm, D5 = 213.85 mm, D4 = 9.8408 mm, D2 = 28.518 mm
The corresponding output responses were:
Mass = 14.258 kg, Maximum Deformation = 0.31545 mm, Maximum Stress = 154.18 MPa
For practical engineering applications, the optimized structural parameters were rounded as follows:
D1 = 15.1 mm, D7 = 146.7 mm, D6 = 4.5 mm, D5 = 213.9 mm, D4 = 9.9 mm, D2 = 28.5 mm
Table 3. Comparison of Wedge Gate Valve Structural Parameters Before and After Optimization
|
Item |
Mass (kg) |
Maximum Deformation (mm) |
Maximum Stress (MPa) |
|
Original Design |
13.836 |
0.34748 |
162.33 |
|
Response Surface Optimization |
10.341 |
0.28545 |
154.18 |
|
Simulation Verification |
10.336 |
0.28742 |
154.23 |
|
Percentage Reduction |
2.53% |
17% |
4.9% |
Analysis of the optimized structural parameters indicates that the reduction in mass of the wedge gate valve is mainly attributable to the suboptimal nature of the initial design. The optimization process rationalized the valve geometry, enhancing self-sealing performance, making the structure more compact, and meeting overall performance requirements.
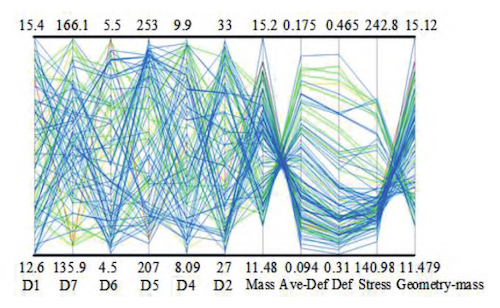
Figure 8. Sample solution set diagram from the multi-objective optimization
This study treated the geometric structural parameters of a wedge gate valve as design variables, with mass, maximum stress, and maximum deformation defined as the optimization objectives. Orthogonal experimental analysis was performed using ANSYS, and response surface prediction models were developed for each objective to characterize the influence of each geometric parameter on valve performance. By combining sensitivity analysis with response surface methodology within the ANSYS Design Exploration module, multi-objective optimization of the wedge gate valve was carried out using a multi-objective genetic algorithm. This approach enabled the rapid and accurate identification of the optimal parameter combination. The optimized design achieved a 2.53% reduction in mass, a 17% reduction in maximum deformation, and a 4.9% decrease in maximum stress, significantly enhancing the self-sealing performance and overall operational reliability of the wedge gate valve.