Axial-Flow Check Valve Opening Characteristics and Whistling Analysis
Abstract: To investigate flow performance and noise generation in axial-flow check valves, hydraulic performance tests were conducted on a test valve to characterize its opening behavior, flow resistance, and whistling characteristics. The results show that the valve begins to open at a flow rate of 15.3 m³/h, indicating good responsiveness under low-flow conditions. The valve reaches the fully open position at 278.1 m³/h, at which point the steady-state flow resistance coefficient is 2.3 and the flow coefficient is 1053. At a flow rate of 461.2 m³/h, pronounced whistling occurs. The analysis indicates that vortex-induced resonance is the primary mechanism responsible for the observed noise. Based on these findings, optimization measures are proposed to reduce noise and improve the flow performance of the axial-flow check valve. The results provide useful guidance for the design of axial-flow check valves with low pressure loss and low noise.
Axial-flow check valves are critical safety components in petroleum, chemical processing, and long-distance pipeline systems. Their primary function is to maintain unidirectional fluid flow and prevent backflow, thereby protecting critical equipment such as pumps and compressors. However, as industrial facilities continue to expand in scale, axial-flow check valves have encountered several operational challenges, including unstable flow characteristics, valve-disc oscillation, and excessive noise. These issues can adversely affect the safety and reliability of pipeline systems. Therefore, experimental investigation and analysis of valve performance are of considerable engineering importance for optimizing valve design and improving its practical applicability.
In recent years, considerable research has been conducted on the flow and dynamic characteristics of axial-flow check valves. Existing studies have mainly focused on valve-disc motion, opening and closing characteristics, flow resistance, and vibration mechanisms.
Wang and others investigated the motion characteristics of the valve disc during the closing process through numerical simulation. Guoguo Wu examined the effects of nominal diameter and external forces on the dynamic characteristics of check valves using numerical simulations. Xiaokang Wu et al. systematically analyzed the opening and closing behavior of check valves under different flow rates. Xiheng Zhang et al. investigated the mechanism of valve-disc oscillation and found that incorporating apertures into the flow-guide shroud could attenuate disc oscillation and reduce the opening time. Fengguan Chen et al. theoretically analyzed the causes of check-valve failure in main oxygen pipelines. Yu and others optimized axial-flow check valves using streamlined design, response surface methodology, and a genetic particle swarm optimization algorithm, respectively, with the objective of reducing flow resistance and energy consumption.
Despite these advances, research on axial-flow check valves still relies predominantly on numerical simulation, while experimental investigations remain relatively limited and available experimental data are insufficient. In particular, experimental characterization of valve opening behavior, flow resistance, and noise generation under different flow rates remains inadequate. Therefore, systematic experimental research is needed to provide reliable data for evaluating valve performance and to support the optimization and practical application of axial-flow check valves.
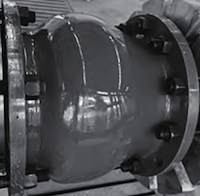
Figure 1 presents the schematic and photograph of a DN200 axial-flow check valve. Experimental tests were conducted to investigate its opening characteristics and flow performance. The whistling observed at high flow rates was also analyzed to identify its potential causes, and optimization measures were proposed to reduce energy loss and noise. The results provide a reference for the design and improvement of axial-flow check valves and offer practical guidance for identifying and mitigating related operational problems.
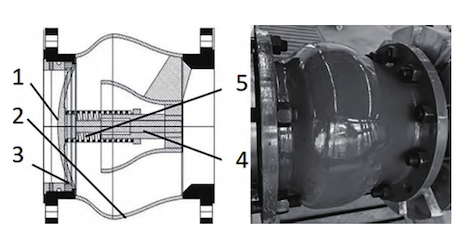
Figure 1. Schematic and photograph of the DN200 axial-flow check valve
1. Valve disc 2. Valve body 3. Valve seat 4. Valve stem 5. Spring
The flow of the water medium within the axial-flow check valve chamber obeys the laws of conservation of mass and conservation of momentum.
The differential form of the continuity equation is given in Equation (1):
∂ρ/∂t + ∇ · (ρu) = 0 (1)
where ρ is the fluid density, kg/m³; t is the time, s; and u is the water flow velocity vector, m/s.
The differential form of the momentum equation is given in Equation (2):
∂(ρu)/∂t + ∇ · (ρuu) = ρf + ∇ · P (2)
where f is the mass force vector, m/s²; and P is the stress tensor, Pa.
The opening and operating characteristics of a DN200 axial-flow check valve were investigated using a valve flow-resistance test system. The system was used to evaluate the valve’s hydraulic performance by determining its flow capacity and flow resistance characteristics and by identifying potential operational problems. The test results provide experimental data for valve structural optimization, energy-loss evaluation, and assessment of its suitability for engineering applications.
The main components of the test system are as follows:
The pump supplies a stable flow of water to the test system. A pressure-stabilizing tank, also referred to as a buffer tank, dampens flow pulsations and helps maintain a stable flow rate.
The test piping system is shown in Figure 2. It consists of a flanged valve mounting fixture and sufficiently long straight pipe sections upstream and downstream of the test valve. These straight sections help establish fully developed flow and minimize flow disturbances in accordance with the applicable test standards. An electromagnetic flowmeter measures the flow rate, while a flow control valve provides precise flow regulation. A differential pressure sensor measures the pressure drop, ΔP, across the test valve.
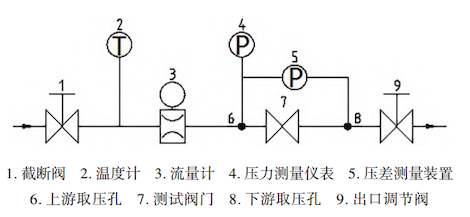
- Shut-off valve
- Thermometer
- Flowmeter
- Pressure measuring instrument
- Differential pressure measurement device
- Upstream pressure tap
- Test valve
- Downstream pressure tap
- Outlet control valve
Figure 2. Test piping system
The test software displays flow rate, pressure drop, and other data in real time, automatically calculates the Kv/Cv values, and can generate test reports.
Air is purged from the pipeline through an exhaust valve. A laser printer allows stored test results to be printed, providing hard-copy archives of the data.
The flow resistance coefficient ξ is calculated as :
ξ = 2Δpv / (ρu₁²) (3)
Where Δpv is the static pressure drop across the valve, Pa; and u₁ is the water velocity, m/s.
The flow coefficient Kv is calculated as:
Kv = 10Q √(1000ρ / (Δpv ρ₁)) (4)
where Q is the volumetric flow rate of water, m³/h; and ρ₁ is the density of water at 15 °C, kg/m³.
The valve began to open at a flow rate of 15.3 m³/h. Once open, it exhibited a low pressure drop and responded rapidly to changes in flow rate. The flow resistance coefficients measured at different flow rates provide reference data for evaluating hydraulic losses and energy consumption under low-flow conditions in practical applications.
At a flow rate of 278.1 m³/h, the valve reached the fully open position. At this point, the steady-state flow resistance coefficient was 2.3, and the flow coefficient was 1053. Throughout the test, the upstream and downstream pressures remained relatively stable over the tested flow range, with no significant fluctuations observed.
Noise generated by axial-flow check valves is an important consideration in industrial applications and is generally subject to applicable environmental and occupational noise requirements. Excessive noise can affect the operating environment and may also contribute to equipment vibration and fatigue-related problems. Therefore, effective control of valve noise is important for maintaining safe and reliable operation. During the tests, pronounced whistling was observed from the DN200 axial-flow check valve at a flow rate of 461.2 m³/h.
The A-weighted total sound pressure level is typically calculated by the energy summation method, using the following formula:

where Lpi is the sound pressure level in the i-th frequency band, dB; and Ci is the A-weighting correction for the corresponding frequency band, obtained from the table in IEC 61672-1 , dB.
According to IEC 60534-8-4 and the principles of acoustic calculation, the external sound pressure levels were calculated for two representative flow rates. The results are as follows:
- At 278.1 m³/h, the external sound pressure level at the peak frequency of the valve's turbulent noise was 46.4 dB, and the external A-weighted overall sound pressure level calculated using Equation (5) was 53.4 dB.
- At 462.1 m³/h, the corresponding external sound pressure level was 62.3 dB, while the external A-weighted overall sound pressure level calculated using Equation (5) was 70.0 dB.
These results indicate that the turbulent noise generated by the test check valve was not the primary source of the pronounced whistling observed during the test.
The occurrence of high-frequency whistling indicates the presence of a discrete-frequency fluid excitation source, characteristic of fluid-induced vibration and noise. The potential causes can be analyzed from the following aspects:
When fluid flows at a relatively high velocity past a non-streamlined bluff body, such as a support rib or the trailing end of a guide vane inside the valve body, alternating vortices are periodically shed downstream, forming a Kármán vortex street.
The vortex shedding frequency depends primarily on the geometry of the bluff body, the approaching flow velocity, and its characteristic dimension. When the vortex shedding frequency approaches the natural frequency of the valve disc or valve body, vortex-induced resonance may occur. The Kármán vortex shedding frequency can be estimated using the following empirical relationship:
Fk= St × (v / T) (6)
Where: Fk = Kármán vortex shedding frequency (Hz); St = Strouhal number; v = flow velocity past the valve disc (m/s); T = characteristic thickness (m).
As the flow velocity increases, the vortex shedding frequency also increases. When the shedding frequency approaches or coincides with the natural frequency of a thin-walled internal component, such as the valve disc, valve stem, or a section of the valve body wall, strong resonance may be induced. The resulting high-frequency vibration, typically in the range of hundreds to thousands of hertz, propagates through the valve body and connected piping and is radiated into the surrounding air, producing the characteristic high-pitched whistling sound.
The disc of an axial-flow check valve is typically preloaded by a spring. If the spring stiffness is improperly selected, particularly if the spring is too soft, high-velocity flow through the gap between the disc and valve seat can produce a complex and unstable pressure distribution. This may cause the disc to undergo small-amplitude, high-frequency oscillations around its equilibrium position or induce periodic flow separation and reattachment downstream of the disc. Such rapid disc motion and flow instability can directly generate noise or, similar to Kármán vortex shedding, excite structural resonance and produce whistling. The flutter frequency is also generally related to the flow velocity.
When fluid flows through a locally constricted region, such as the narrow passage formed when the valve disc is close to the closed position, the flow velocity can increase sharply, resulting in a significant local pressure drop. If the local pressure falls below the saturated vapor pressure of the fluid at the corresponding temperature, vapor cavities form in the flow. As these cavities are transported downstream into a higher-pressure region, they can collapse rapidly, generating pressure fluctuations, vibration, and noise. Common approaches for evaluating cavitation include the cavitation coefficient method and the critical pressure ratio method.
(1) Cavitation coefficient analysis
The cavitation coefficient is used to quantify the risk of cavitation,and its expression is:

where P₁is the absolute pressure upstream of the valve (MPa), P₂is the absolute pressure downstream of the valve (MPa), and Pv is the absolute saturated vapor pressure of the fluid (MPa).
(2) Critical pressure ratio analysis method
This method is used to calculate the maximum allowable pressure drop without cavitation, expressed as:

where FL is the liquid pressure recovery factor.
If the actual pressure drop ΔP = P₁ - P₂ > ΔP_allow, cavitation will occur; if ΔP < ΔP_allow, cavitation will not occur.
The collapse of cavitation bubbles produces high-frequency pressure pulses that can be perceived as crackling or popping noise, similar to the sound of flowing sand or gravel. Under intense and highly localized bubble collapse, individual acoustic emissions may overlap, resulting in continuous high-frequency noise that can resemble whistling or shrieking. However, cavitation noise generally exhibits a broadband, crackling or popping characteristic rather than a distinct tonal whistle.
When the check valve is fully open, significant cavitation is generally less likely than vortex-induced noise, unless an improper disc design or severe wear creates localized high-speed jets. Nevertheless, increasing flow velocity can increase the local pressure drop and thereby raise the risk of cavitation.
Manufacturing defects and wear-related changes can significantly affect the stability of the internal flow field, primarily through the following mechanisms:
- Burrs and sharp edges: Machining burrs and insufficiently rounded edges on critical components, such as support ribs and disc edges, can act as vortex generators, intensifying Kármán vortex shedding and the resulting flow-induced noise.
- Excessive guide clearance: Machining errors or wear can increase the clearance between the disc guide stem and guide bushing, reducing disc stability in the flow field and causing chatter and additional flow-induced noise.
- Welding slag and foreign matter: Residual welding slag, metal debris from assembly, and other hard contaminants can disturb the flow field and generate abnormal noise.
These defects and wear-related conditions can adversely affect the hydraulic performance and noise characteristics of the valve.
No abnormal noise associated with valve-disc impact was observed during the tests. After the test, the valve was inspected following shutdown. The inspection confirmed that the spring stiffness was adequate, while burrs, sharp edges, visible wear, deformation, and foreign matter were not observed. These findings ruled out the above factors as the primary causes of the observed whistling.
Based on the test data, at a flow rate of 461.2 m³/h, the cavitation coefficient of the test check valve was calculated to be 4.7. Since this value exceeds 1, and the allowable pressure drop (ΔP_allow = 142 kPa) is greater than the actual pressure drop (ΔP = 31 kPa), it can be concluded that the whistling is not caused by fluid cavitation.
After other potential causes were ruled out, the analysis indicated that vortex-induced resonance may be the primary cause of the observed whistling. During the test, when the whistling occurred, the Kármán vortex shedding frequency at the trailing edge of the guide shroud was preliminarily estimated to be at or below 20 Hz. This frequency is near or within the infrasonic range and is therefore unlikely to provide sufficient direct excitation for the observed high-frequency whistling.
The whistling may therefore be associated with resonance resulting from the proximity between the natural frequencies of the valve structure and the flow-induced excitation frequencies generated as the fluid passes the internal ribs. This mechanism requires further investigation and verification through numerical simulation and modal analysis. In future work, potential optimization measures include modifying critical structural dimensions, adjusting the spring stiffness, and changing the mass of key components, such as the valve disc. These measures can shift the structural natural frequencies away from the dominant flow-induced excitation frequencies, thereby reducing the risk of resonance and whistling.
This study experimentally investigated the opening and flow characteristics of a DN200 axial-flow check valve and analyzed the possible causes of the whistling observed during testing. The main conclusions are as follows:
- The axial-flow check valve began to open at a flow rate of 15.3 m³/h and exhibited good responsiveness under low-flow conditions. When the valve reached the fully open position at a flow rate of 278.1 m³/h, the steady-state flow resistance coefficient was 2.3 and the flow coefficient was 1053. The test results provide reference data for evaluating hydraulic losses, estimating energy consumption, and selecting and applying axial-flow check valves under different flow conditions.
- After potential causes such as cavitation, valve-disc flutter, and internal geometric defects were excluded, the analysis indicated that vortex-induced resonance may be the primary mechanism responsible for the observed whistling. Potential measures for suppressing the noise include shifting the structural natural frequencies away from the dominant vortex shedding frequencies by modifying critical structural dimensions and adjusting the spring stiffness and valve-disc mass.
The streamlined profile of the tested axial-flow check valve still has potential for further optimization. Future studies could optimize the axisymmetric profile by combining flow-design principles, such as the Venturi effect, the ellipse-cluster method, and the source-sink method, with mathematical optimization techniques, including orthogonal design, Kriging interpolation, and the genetic algorithm-particle swarm optimization (GA-PSO) method.